If your website goes down at 2 AM, would you know? Most business owners wouldn't — not until a customer sends a frustrated email the next morning. That's exactly the problem our built-in Server Monitor solves.
Every Faciotech hosting client gets access to a powerful, real-time monitoring system at no extra cost. You can track up to 10 monitors — covering websites, mail servers, DNS records, SSL certificates, and more — all from your client dashboard.
In this guide, we'll walk you through exactly how it works, screen by screen.
What Can You Monitor?
The Server Monitor supports six different check types, each designed for a specific use case:
- HTTP / HTTPS — Verify your website is loading and returning the correct status code. You can even check for specific text in the response to catch partial failures.
- Ping — Basic connectivity check using ICMP. Perfect for verifying a server is reachable.
- Port — Check if a specific TCP port is open (e.g., port 993 for IMAP, port 3306 for MySQL).
- DNS — Verify that your domain's DNS records (A, AAAA, CNAME, MX, TXT, NS) resolve correctly.
- SSL Certificate — Monitor your SSL certificate's validity and get alerts before it expires.
Your Monitoring Dashboard
Once you log into your Faciotech client area, navigate to Server Monitor to see your dashboard. At a glance, you'll see how many monitors are up, down, or pending — plus your overall average uptime.

From here you can:
- Add new monitors
- Configure alert contacts (email, SMS, or webhook)
- Schedule maintenance windows
- Generate SLA compliance reports
- Create public status pages
- Manage API keys for external integrations
Adding Your First Monitor
Click "Add Monitor" to set up a new check. The form walks you through everything — give it a name, pick the type, enter your target URL or domain, and choose how often to check.
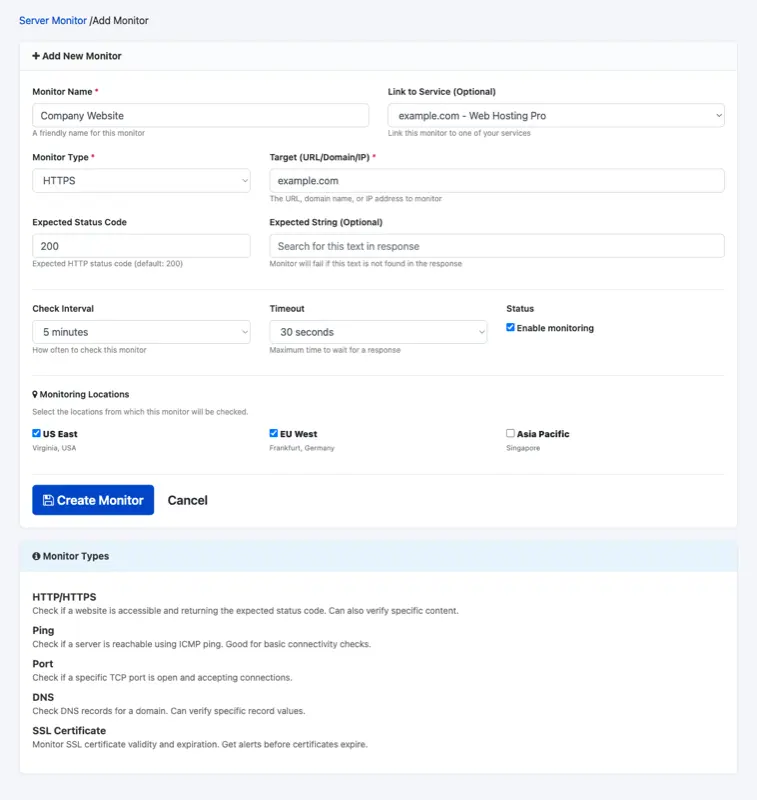
Key options include:
- Check interval — From every 1 minute to every 1 hour
- Expected status code — Default is 200, but you can set any valid HTTP code
- Expected string — Optionally verify that specific text appears in the response (catches edge cases where the server returns 200 but shows an error page)
- Monitoring locations — Check from multiple geographic locations. The monitor is only marked as "down" when all selected locations agree, reducing false positives
- Link to service — Connect the monitor to one of your Faciotech hosting services for easy reference
Monitor Detail View
Click on any monitor to see its detailed view — including a 30-day response time chart, recent check logs, quick stats, and incident history.
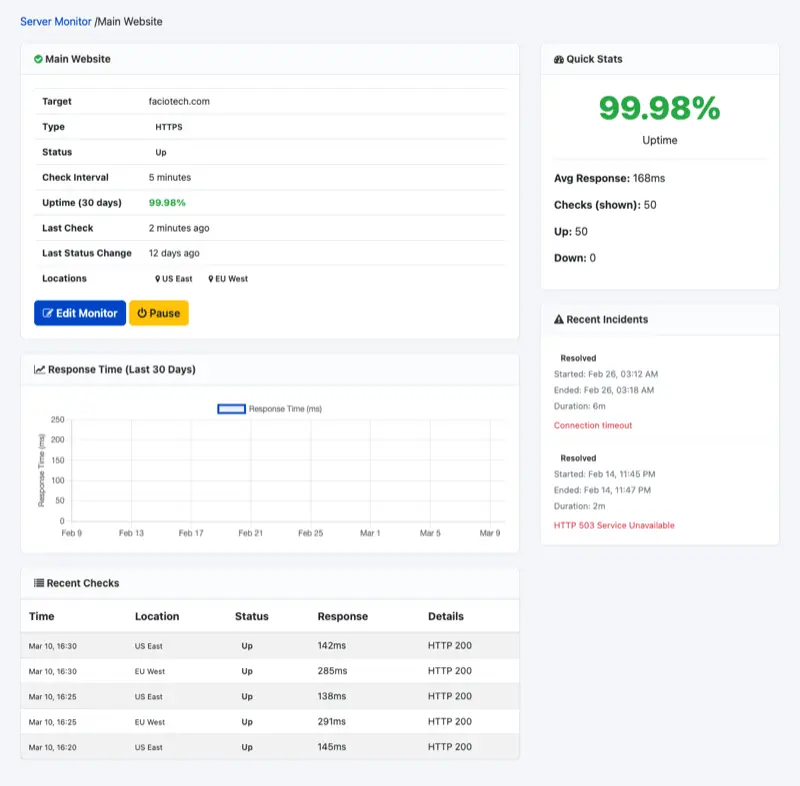
The response time chart helps you spot patterns — maybe your site slows down during peak hours, or a recent change introduced latency. The incident history shows exactly when downtime occurred, how long it lasted, and what error was returned.
Alerts: Get Notified Instantly
Monitoring is only useful if you know about problems when they happen. The alert system supports three notification channels:
- Email — Receive detailed alert emails when a monitor goes down or recovers
- SMS — Get text messages for critical monitors (include your country code)
- Webhook — Send alert data to Slack, Discord, PagerDuty, or any custom URL via POST request
You can link specific alert contacts to specific monitors — so your main website might alert via email + SMS, while a staging server only sends an email.
Public Status Pages
Want to show your customers that your services are running? Create a public status page — a branded, real-time dashboard showing the current status of each service you choose to display.
Features include:
- Custom URL slug (e.g.,
faciotech.com/status/my-services) - Optional custom domain via CNAME (e.g.,
status.yourcompany.com) - Email subscriptions — visitors can subscribe to updates
- Choose which monitors to display and in what order
This is especially valuable for SaaS businesses, agencies, and anyone who wants to be transparent about service availability.
SLA Reports
Need to prove uptime for a client contract or internal review? The Reports section generates detailed SLA compliance reports with:
- Overall uptime percentage for any date range
- Daily breakdown with checks, up/down counts, and average response times
- SLA target comparison (e.g., 99.9%) — see which days met or missed the target
- Incident timeline showing every downtime event
- Export to CSV or print-ready format
How to Get Started
- Log in to your Faciotech client area
- Navigate to Server Monitor in the menu
- Click "Add Monitor"
- Enter your website URL, choose HTTPS, set interval to 5 minutes
- Click "Create Monitor"
That's it — your website is now monitored 24/7. You'll receive alerts the moment anything goes wrong, and you can track performance trends over time.
Included Free with Every Hosting Plan
The Server Monitor is included at no extra cost with all Faciotech hosting plans. Every client can create up to 10 monitors — enough to cover your main website, staging environment, mail server, DNS, and SSL certificates.
If you're not already using it, log into your client area today and set up your first monitor. It takes less than two minutes, and it could save you hours of downtime.
Questions? Open a support ticket and our team will help you get set up.